


How to find and fix memory leaks in Go applications
Blogs· 6min November 24, 2022
Imagine one day you prepare a proof of concept application. You quickly write some code that shows your idea, add tracing and metrics so you can see how it performs, deploy the application to test environment and boom, after running for 1 hour the application restarts with Out Of Memory error. This screams "memory leak", but you look into the code and see nothing obvious. You may start thinking that overall restart every hour isn't that bad. If you are thinking like that, I encourage you to keep reading as I'm going to guide you on how to debug and fix memory leaks in Go applications.
Example application
A simple setup that demonstrates the problem can be found on GitHub. It contains docker-compose.yml file with following services:
- prometheus for collecting metrics
- zipkin for collecting traces
- leaker which is a service that contains a memory leak
- client which is a script that generates some load against leaker
Leaker
leaker is a simple gin application that exposes few HTTP endpoints:
- / that always returns "OK" is the one that client calls
- /metrics that returns prometheus metrics
- debug/pprof/*profile that returns profiling data (more on that later)
Traces are exported to zipkin inside the global middleware added with router.Use. Note, that function passed to router.Use is executed on every request.
Running the stack
We can just start the whole stack with docker-compose up -d, wait for a few minutes and then visit local prometheus to see a graph similar to the one below
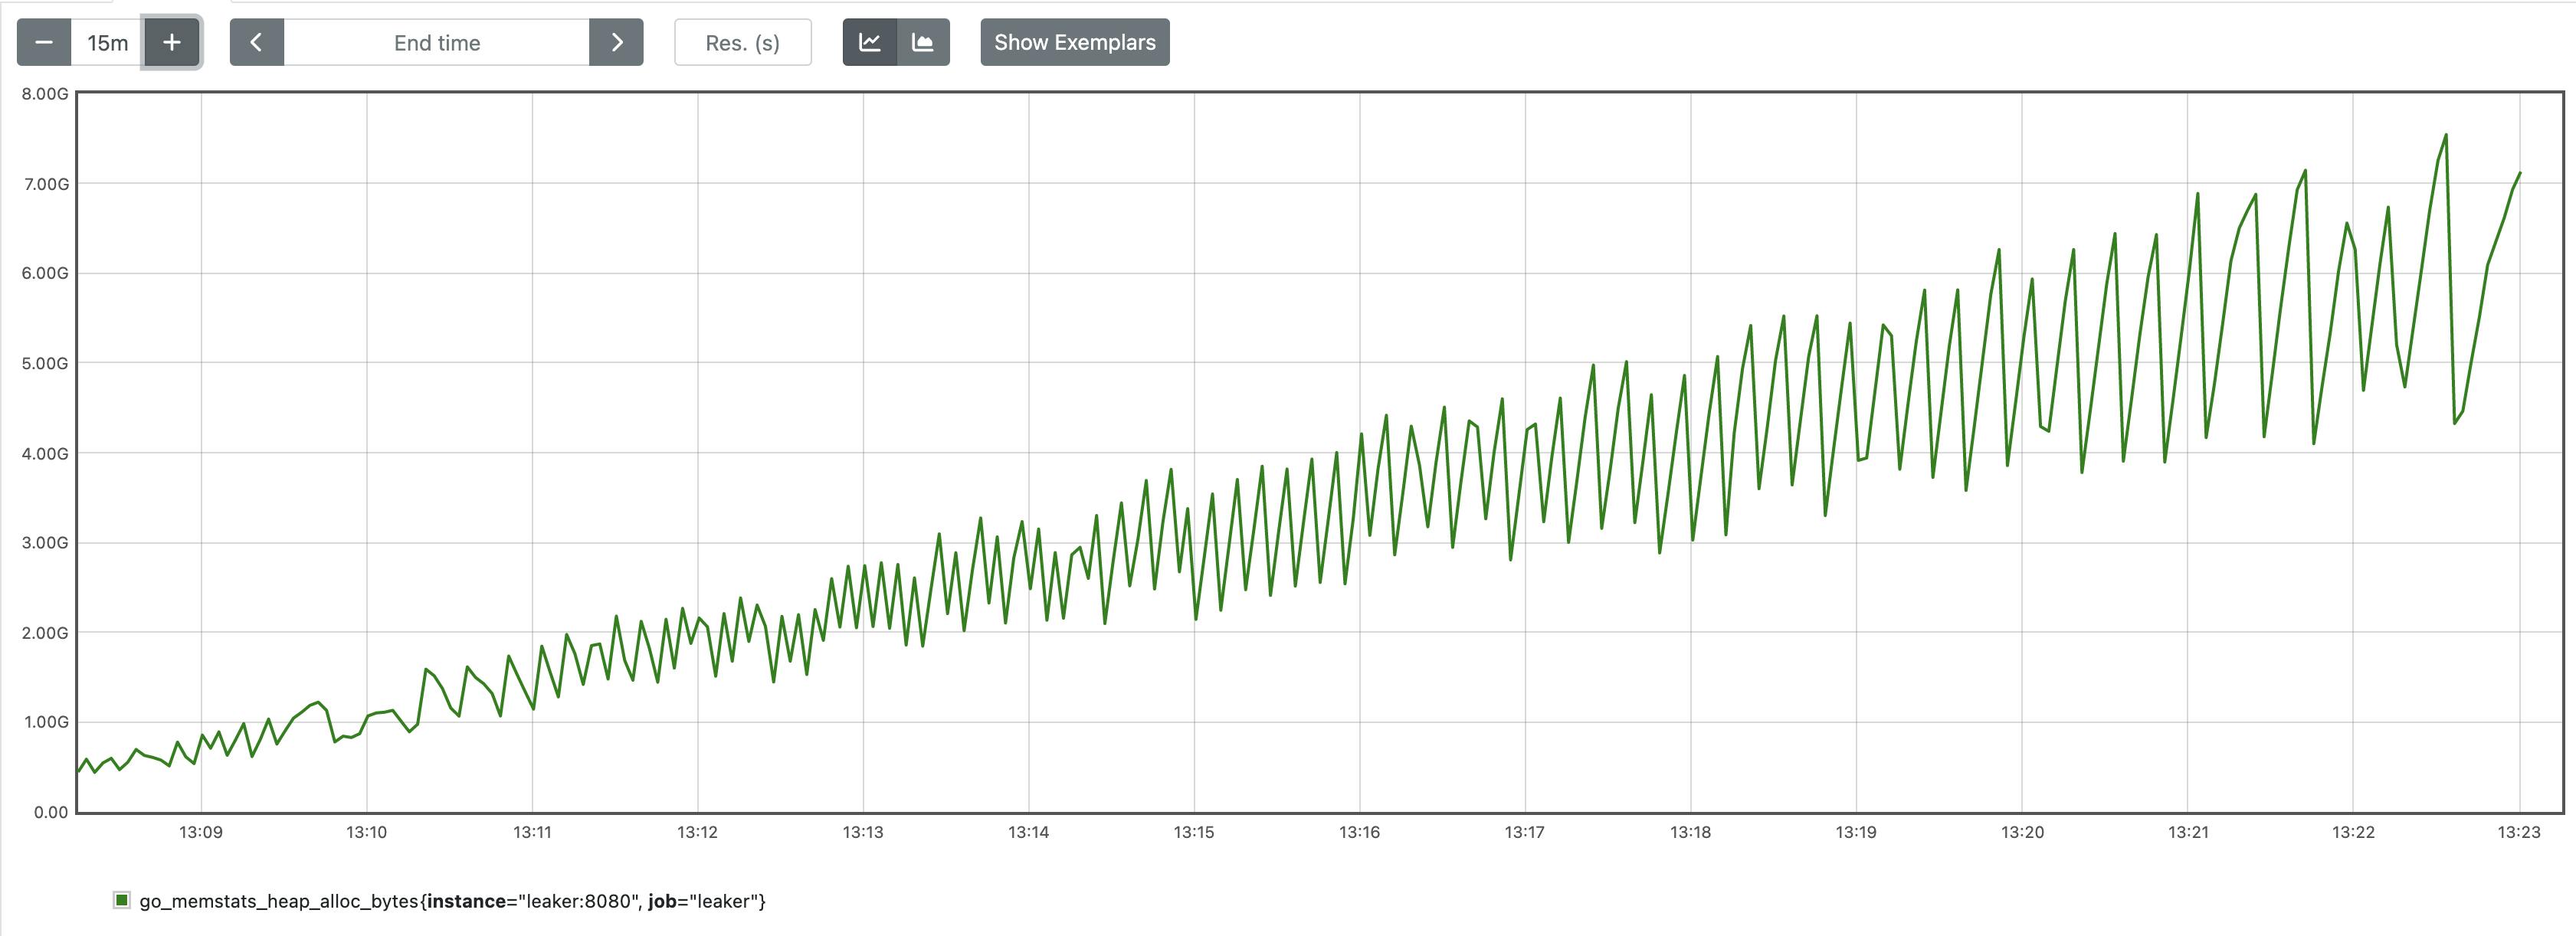
We can clearly see something is not right. Our application isn't supposed to have constantly growing in-memory state, but we can clearly see that memory consumption is increasing with every request. In the next sections I'm going to show you the steps needed to identify and fix the issue.
Introduction to pprof
Per the documentation, pprof is a tool for visualization and analysis of profiling data. Profile is a gzipped protobuf file in a profile.proto format. What's nice about the format is that it's very generic. It's easy to generate your own profile and then use pprof to visualize and analyse it. For example net/http/pprof package can be used to analyse CPU profiles, past allocations, holders of contended mutexes and more.
Instrumenting the application
But how do we get pprof data from our application? Our sample application is using gin, so we will expose pprof data with it. We will add an endpoint to our router, so our application will be capable of rendering profiles it has collected.
router.GET("/debug/pprof/*profile", gin.WrapF(pprof.Index))note, that /debug/pprof/*profile path is important, as pprof.Index trims the prefix to obtain the profile name. After adding the instrumentation, we can visit http://localhost:8080/debug/pprof/ to see list of profiles. In our case we're interested in the heap profile. We can see human readable report under http://localhost:8080/debug/pprof/heap?debug=1.
Let's stop for a little bit here and just for the sake of curiosity figure out what we see (feel free to skip to the next section if you just want to know how to efficiently analyse a profile). Looking at the first line, you should see something like
heap profile: 4678: 509744696 [324302: 6210715928] @ heap/1048576I'm going to follow the pprof source code to decipher what each of the values mean. Therefore we have 4678 objects in use, that occupy 509744696 bytes in total. Total number of allocated objects is 324302 and total allocated bytes is 6210715928. heap/1048576 is related to sampling, and 1048576 is actually 2*MemProfileRate. It means, that one allocation sample gets collected every 512KB allocated (so 1048576B / 2). It then can be used to estimate actual, not sampled values.
After that we see a list of memory profile records, sorted by total in use bytes. First sample would look similar to
1: 505380864 [1: 505380864] @ 0x56fe60 0x59a928 0x59a540 0x5b67fc 0x4936d4 0x4933ad 0x492fa0 0x289868 0x284f50 0x7cc64
#	0x56fe5f	go.opentelemetry.io/otel/metric/internal/global.(*siInstProvider).Counter+0x17f			/app/vendor/go.opentelemetry.io/otel/metric/internal/global/meter.go:327
#	0x59a927	go.opentelemetry.io/contrib/instrumentation/net/http/otelhttp.(*Handler).createMeasures+0xb7	/app/vendor/go.opentelemetry.io/contrib/instrumentation/net/http/otelhttp/handler.go:101
#	0x59a53f	go.opentelemetry.io/contrib/instrumentation/net/http/otelhttp.NewHandler+0x38f			/app/vendor/go.opentelemetry.io/contrib/instrumentation/net/http/otelhttp/handler.go:75
#	0x5b67fb	main.main.func1+0xbb										/app/main.go:42
#	0x4936d3	github.com/gin-gonic/gin.(*Context).Next+0x573							/app/vendor/github.com/gin-gonic/gin/context.go:173
#	0x4933ac	github.com/gin-gonic/gin.(*Engine).handleHTTPRequest+0x24c					/app/vendor/github.com/gin-gonic/gin/gin.go:616
#	0x492f9f	github.com/gin-gonic/gin.(*Engine).ServeHTTP+0x1ff						/app/vendor/github.com/gin-gonic/gin/gin.go:572
#	0x289867	net/http.serverHandler.ServeHTTP+0x407								/usr/local/go/src/net/http/server.go:2916
#	0x284f4f	net/http.(*conn).serve+0x54f									/usr/local/go/src/net/http/server.go:1966
We can notice that there is 1 in use object, occupying 505380864 bytes (it's subject to sampling described above, so it's not an actual value!). There was only 1 object allocated with total allocated bytes of 505380864 (again, subject to sampling). Then the allocation stack trace follows so we can better understand where the allocations come from.
Interpreting the results
While for our simple use case report from the previous section would most likely be enough, it's still worth to know how to present it in more human readable way so we know how to handle real world scenarios as well. To display the report in a browser, we can run
pprof -web http://localhost:8080/debug/pprof/heapwhich would show report similar to the one below.
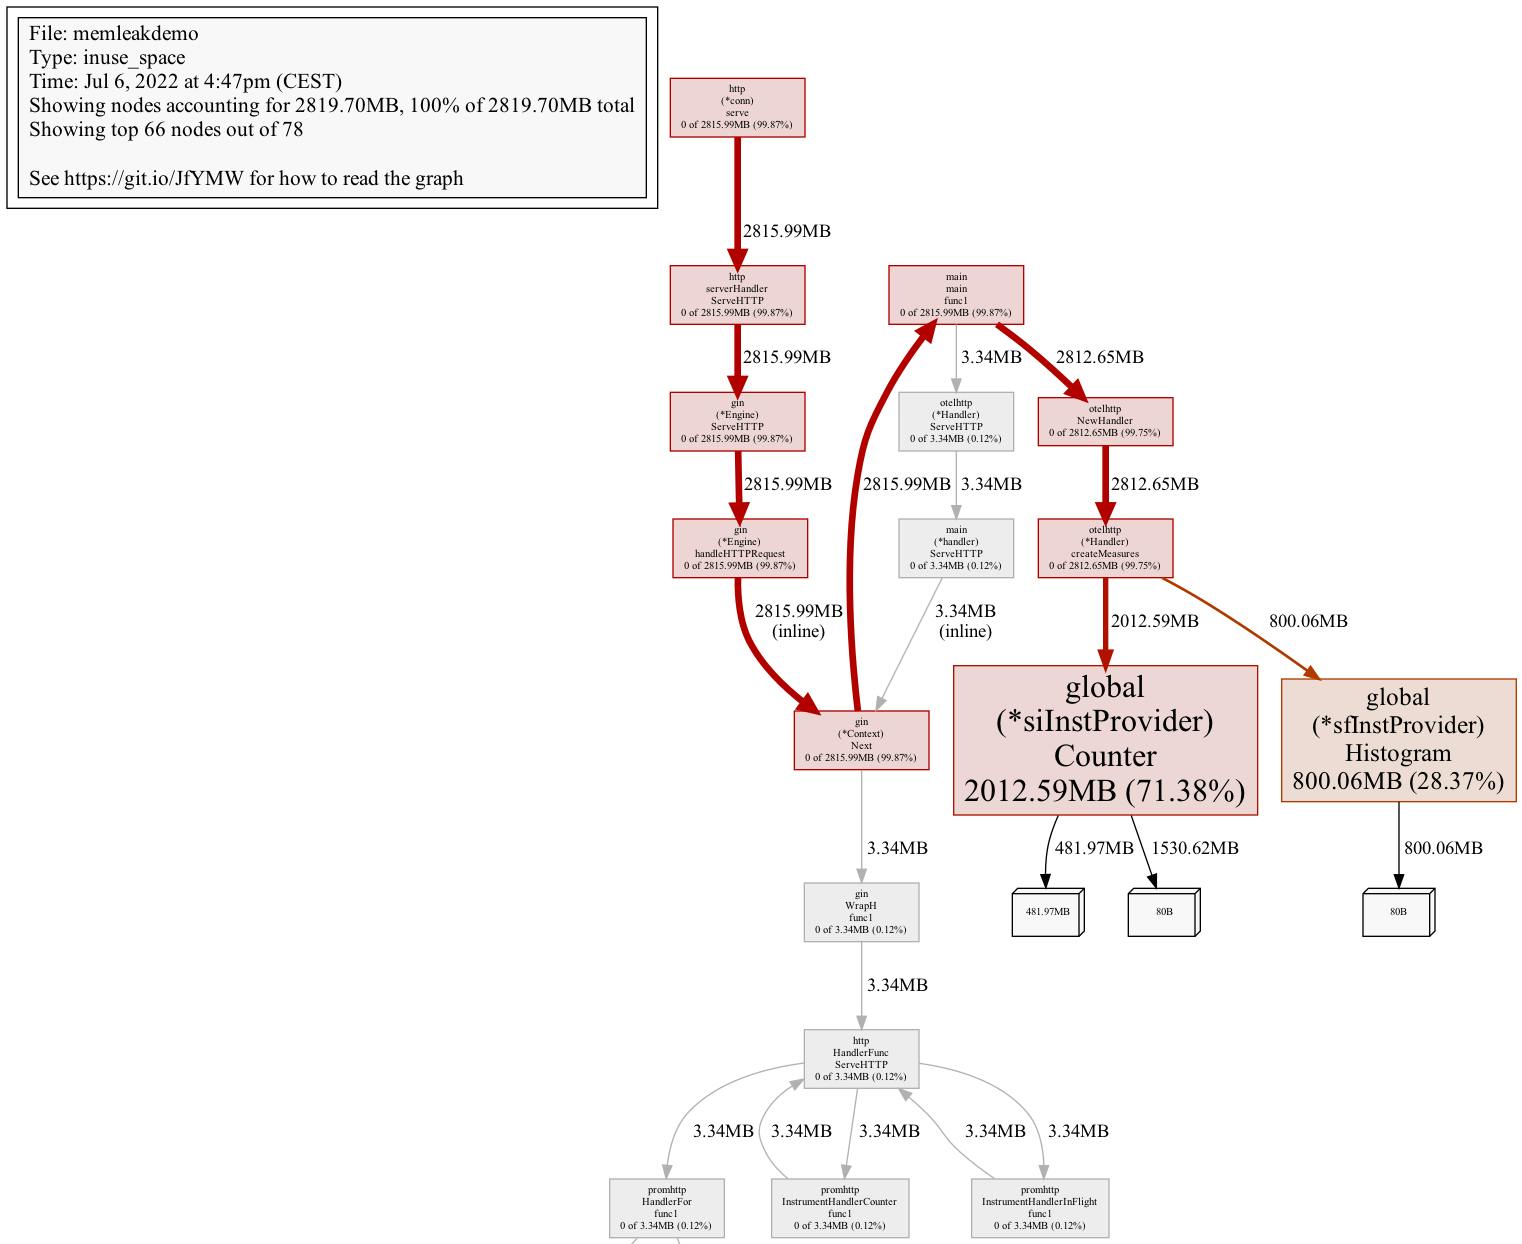
It contains everything we need, including the instruction how to read the graph. When searching for memory leaks we would focus on red nodes (so ones with large cumulative values). We would follow thick red edges (so ones that have large amount of resources created) and stop on nodes with larger font size (so ones that have large flat values). Note, that pprof is quite smart in terms of what to present on the graph, therefore your graph may contain considerably fewer nodes (i.e. only relevant red ones). You can show more nodes with
pprof -web -nodefraction=0 http://localhost:8080/debug/pprof/heapFrom the graph we can conclude, that we should look at global (*siInstProvider) Counter first. Problem is that, in larger functions it may not be obvious which allocation is the actual memory leak, so we can improve our graph a little bit. We would reduce noise and only show samples going through createMeasures node (as this is the ancestor of nodes with the largest flat values). We would also aggregate by source code line level, so that we can get precise source code locations. Therefore, the command would evolve to:
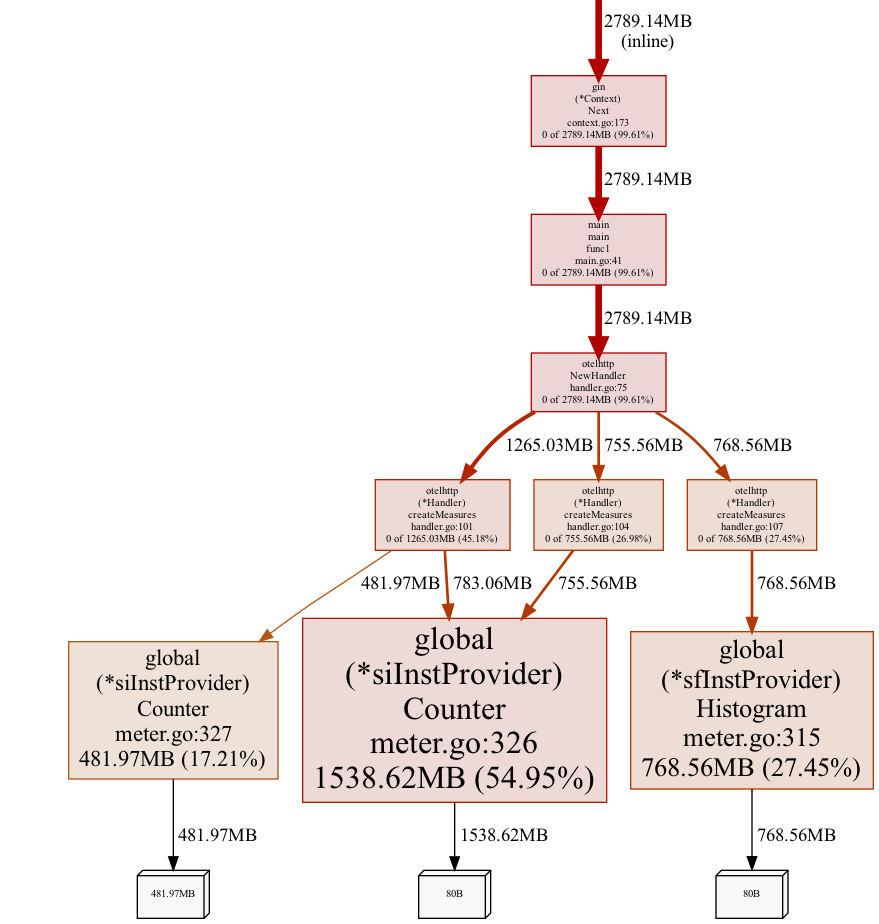
pprof -web -focus=createMeasures -lines http://localhost:8080/debug/pprof/heapThis would open a graph similar to the one below.
Fixing the bug
From the analysis above, we can deduce that code that allocates the leaking resources (that we can control) lives in main.go:41:
handlerWithMetrics := otelhttp.NewHandler(h, "root")Reason why the service is leaking resources is that we create otelhttp handler for each request (it's inside a global middleware). Creating otelhttp handler creates counters and a histogram internally and appends them to the global meters (by default).
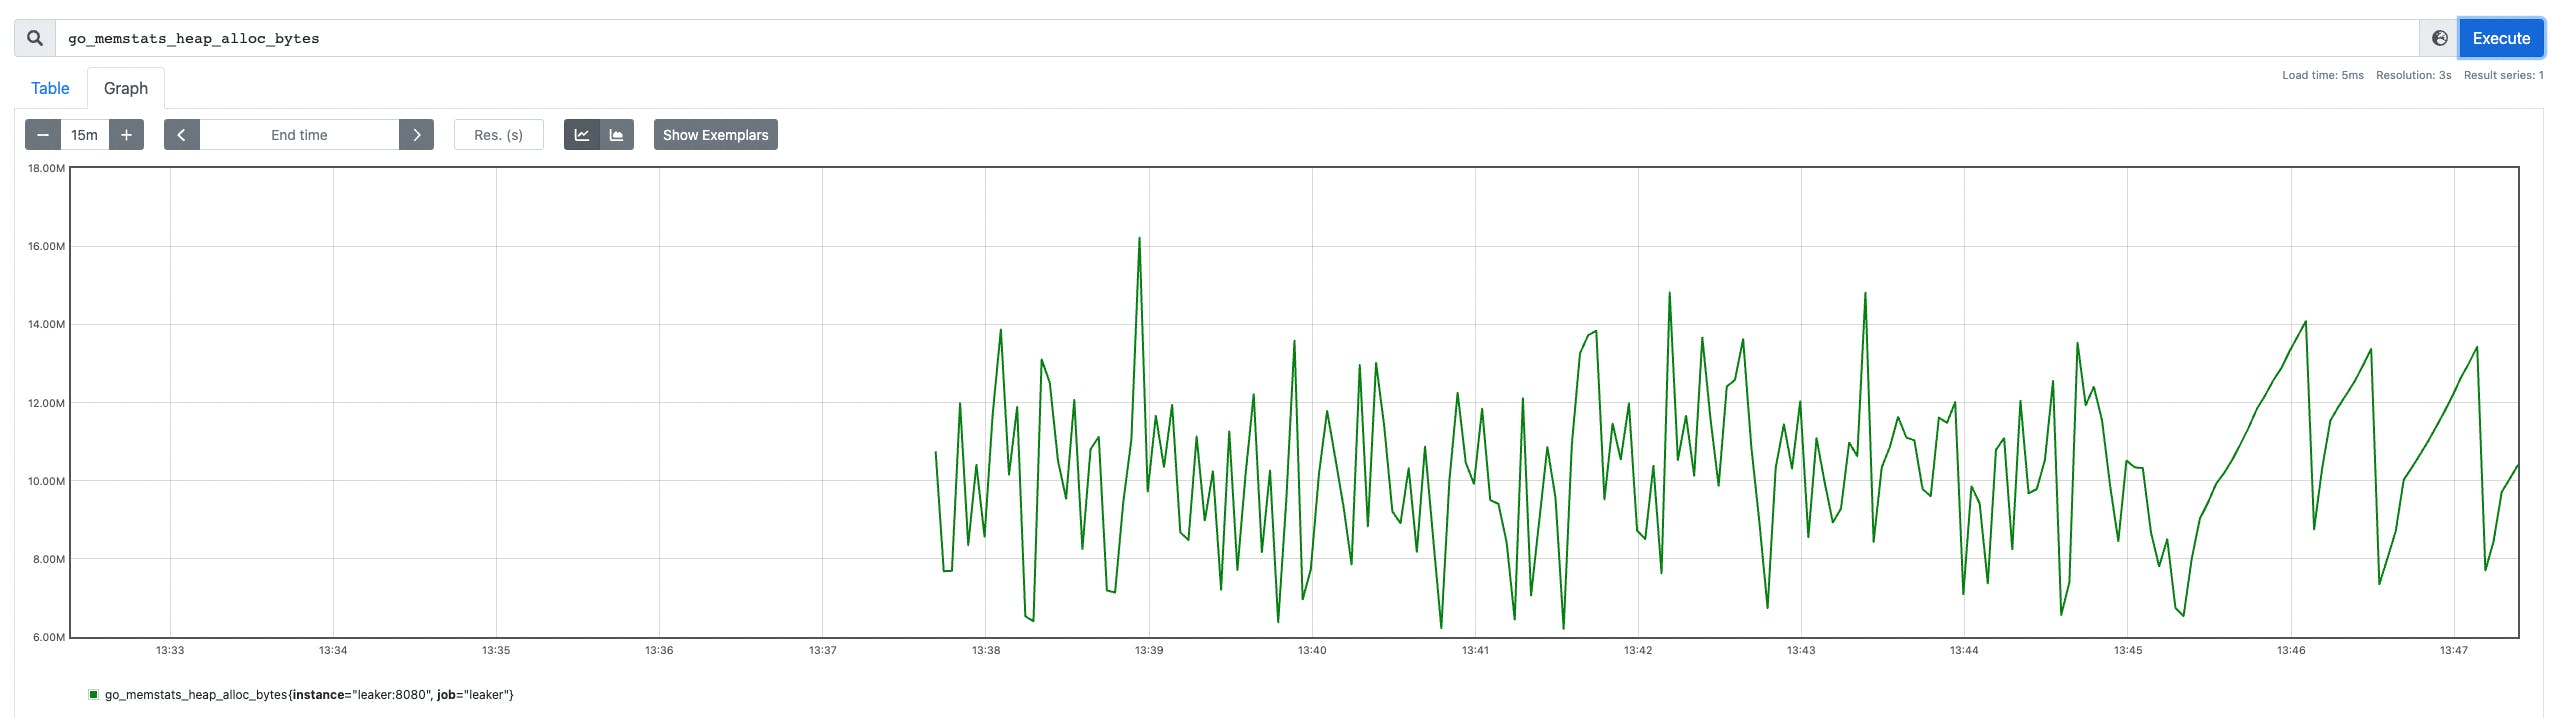
Fortunately, this is easy to fix - we should create otelhttp handler once and wrap gin handler with it. Code without the leak can be found on the fixed-leak branch. After the change, memory graph looks much more stable:
Conclusions
We've covered:
- pprof format
- how to instrument and expose profile data from your applications
- how to use pprof to interpret heap memory profiles
Hopefully from now on finding and fixing next memory leak in your own applications is going to be a breeze.
Written by


Michał Szczygieł is Senior Software Engineer at Form3. His experience varies from creating native Windows applications with Delphi to developing complex backend systems with functional Scala. Recently he's started to explore the Go programming language and its ecosystem.