


Keeping Customers Informed During Incidents with Prometheus
Table of contents
Blogs· 10min May 24, 2023
Maintaining customer satisfaction during incidents is crucial for any business. In this blogpost, Piotr shares how we leverage Prometheus to expose business metrics in a secure and cost-effective way to keep customers informed and happy during those stressful situations.
Introduction
In today's rapidly-evolving digital landscape, a strong online presence and seamless service delivery are crucial for businesses to keep their competitive edge. For industries such as payments, where interruptions in service can result in significant financial and reputational consequences, incident management is especially critical.
In the past, businesses relied on basic processes to detect and respond to incidents, such as posting updates on social media platforms like Twitter. Unfortunately, these approaches often resulted in slow response times and poorly structured communication with customers. As customer expectations continue to rise, mature incident management processes have become essential. While it's impossible to completely prevent incidents, businesses must have reliable and robust processes in place to detect, respond, and communicate effectively during incidents.
At Form3, we take our incident management processes a step further by providing customers with the ability to integrate product metrics into their incident response procedures. Unlike many third-party providers who only offer dashboard displays of their products, we offer our customers the ability to fetch and convert Prometheus metrics into different formats, enabling seamless integration with their chosen monitoring solutions. This means our customers are able to assess the impact of the outage, enabling them to take their own mitigation steps and communicate effectively with customers of their own.
While our approach offers many benefits and significant value for our customers, it also presents a unique set of challenges on both technical and organisational levels. In this series, we will guide you through our complete solution, with a focus on metric consumption in this first article, followed by two subsequent articles. Part 2 (link to follow!) will focus on secure and effective method of metric ingestion. In Part 3 we will zoom out to the organisational level and the challenges that come with effective implementation of this product.
Let's begin!
Metrics Isolation Problem
As previously mentioned, Form3's preferred monitoring system is Prometheus. While we won't delve too deeply into the specifics of its functionality, it is a cloud-agnostic, open-source project licensed under Apache 2.0, solution that provides us with the ability to monitor our infrastructure and applications using metrics such as counters, gauges, and histograms. We utilise these metrics in a number of ways, including using them in conjunction with Grafana, which is a metric, logs and tracing visualisation software. We are using their SaaS offering that enables us to focus on value added services, exactly like the one described in this article. These tools provide benefits both from a debugging perspective of our systems and for alerting purposes that summon on-call engineers when something goes bad. To make metrics easily explorable and engineer-friendly, we typically store them in a single storage location per environment, with isolation between environments to prevent errors in one environment from affecting another. Nonetheless, this approach presents a challenge:
How do we split metrics, make them accessible to customers and not break a bank at the same time?
The problem is that External Metrics are stored in the same location as internal metrics, and creating a separate storage location would be costly in terms of additional servers and fees, especially as we are a multi-tenant platform. Storing metrics separately for each customer is just not feasible.
Enter Metrics API
To address this issue, we have developed Metrics API, a query-enhancing service that enables us to store all metrics together while still providing access to a subset of external metrics.
Metrics API will serve as an intermediary between our Prometheus server and our customers. When a customer wants to access their metrics, Metrics API will authenticate their request and check if they have access rights based on their organisation ID. If authorised, Metrics API will execute a PromQL query against the Prometheus server to retrieve the requested metrics and return them to the customer.

To implement this solution, we will expose this service via an API gateway that will handle the authentication and authorisation of the requests. The API gateway will also handle rate limiting and other security-related concerns.
Slice & Dice Metrics
In order to separate internal and external metrics while minimising costs, Metrics API service splits metrics into subsets based on their labels. This is possible thanks to PromQL (Prometheus Query Language), which allows us to slice and dice metrics in various ways, given the source of the metric assigns special labels to it to indicate its dimensions.
For example, to distinguish between internal and external metrics, we can add a unique label, such as metric_purpose="external". To split them for each customer, we can use a UUID label for each organisation represented on our platform (e.g.: organisation_id="UUID") or anything that identifies the entity for which the metric is produced. Additional dimensions such as a list of products could also be added with labels like origin="product_name". However, we should be aware that each label increases maintenance costs as it introduces new complexities to the code.
In summary, the following query will retrieve all external metrics for an organisation with a given UUID: {metric_purpose="external", organisation_id="UUID"}. In addition to that Metrics API also includes usability features, such as automatic label filling so customers can submit any valid query, for instance an empty one: {}.
# Example request described above
curl 'https://example-request.com/path_prefix/api/v1/query?query={metrics_api%3D%22external%22%2C%20organisation_id%3D%22d438bef8-a5ea-4aa1-bc1a-d5681e62515c%22%0A}'
So, the problem we're solving with Metrics API is
How do we enforce the minimal required set of labels on each customers' query?
When it comes to providing good isolation of metrics through label selectors, we need to be careful with labels that allow for looser selection, such as organisation_id. For example, if a customer has multiple organisations but only one user to fetch these metrics, on the one hand we would want to allow them to select a subset of organisation IDs instead of just one. On the other hand however, we cannot allow just any regular expression for these labels when the customer has full power for it. Therefore, we only allow a very limited set of regular expressions, such as an alphanumeric string (without special characters) or an alternative of them - organisation_id =~ "UUID1|UUD2". Negative queries, such as organisation_id != X, are all forbidden in order to prevent potential security risks. Moreover, we don't need to worry about other labels, as the restricted labels properly narrow down the set of queryable metrics.
The Implementation
Now that we understand why we need Metrics API, what problem we're trying to solve, and how to do it, let's talk about the implementation.
Implementation Scope
Metrics API is essentially a HTTP proxy that mimics a subset of Prometheus API endpoints. While we won't go into details about the general implementation, we'll focus on the interesting parts: which endpoints we need to implement, how to implement them using Prometheus as a library, and what technical challenges we faced during the implementation.
The core functionality of Metrics API is to fetch metric data in Prometheus format. In other words we're interested in implementing these three endpoints: /api/v1/query, /api/v1/query_range, and /federate.
- /api/v1/query endpoint is used by Grafana, among others, in stat panels to display a current statistic.
- /api/v1/query_range endpoint is used by Grafana in time series panels to display how the value changes in time.
If your customers only use Grafana, these endpoints would suffice. We should also note that while you could implement additional endpoints for querying label names and values, they may not add much value compared to the implementation effort required.
- /federate endpoint, on the other hand, allows Prometheus instances to be federated. One useful scenario is that customers can set up their own Prometheus instance to federate with Metrics API and send alerts based on their custom alerting rules.
The Heart of Metrics API
Now let's move on to the core of the Metrics API service - its query enhancing engine. At Form3, the majority of our services are implemented using Go. Go is a programming language that was developed by Google, with a focus on building efficient, scalable, and reliable software. Because of its simplicity, speed, and ease of use, it is an ideal language for our purposes.
Prometheus is written in Go, we were able to leverage its functionality with minimal effort to securely parse and enhance incoming PromQL queries. To parse the query, we utilise the ParseExpr function from the github.com/prometheus/prometheus/promql/parser package, which returns an expression struct that represents the abstract syntax tree of the input query.
As an example, consider the following Prometheus query: rate(http_requests_total{job="api-server"}[5m]). The corresponding abstract syntax tree is shown below:
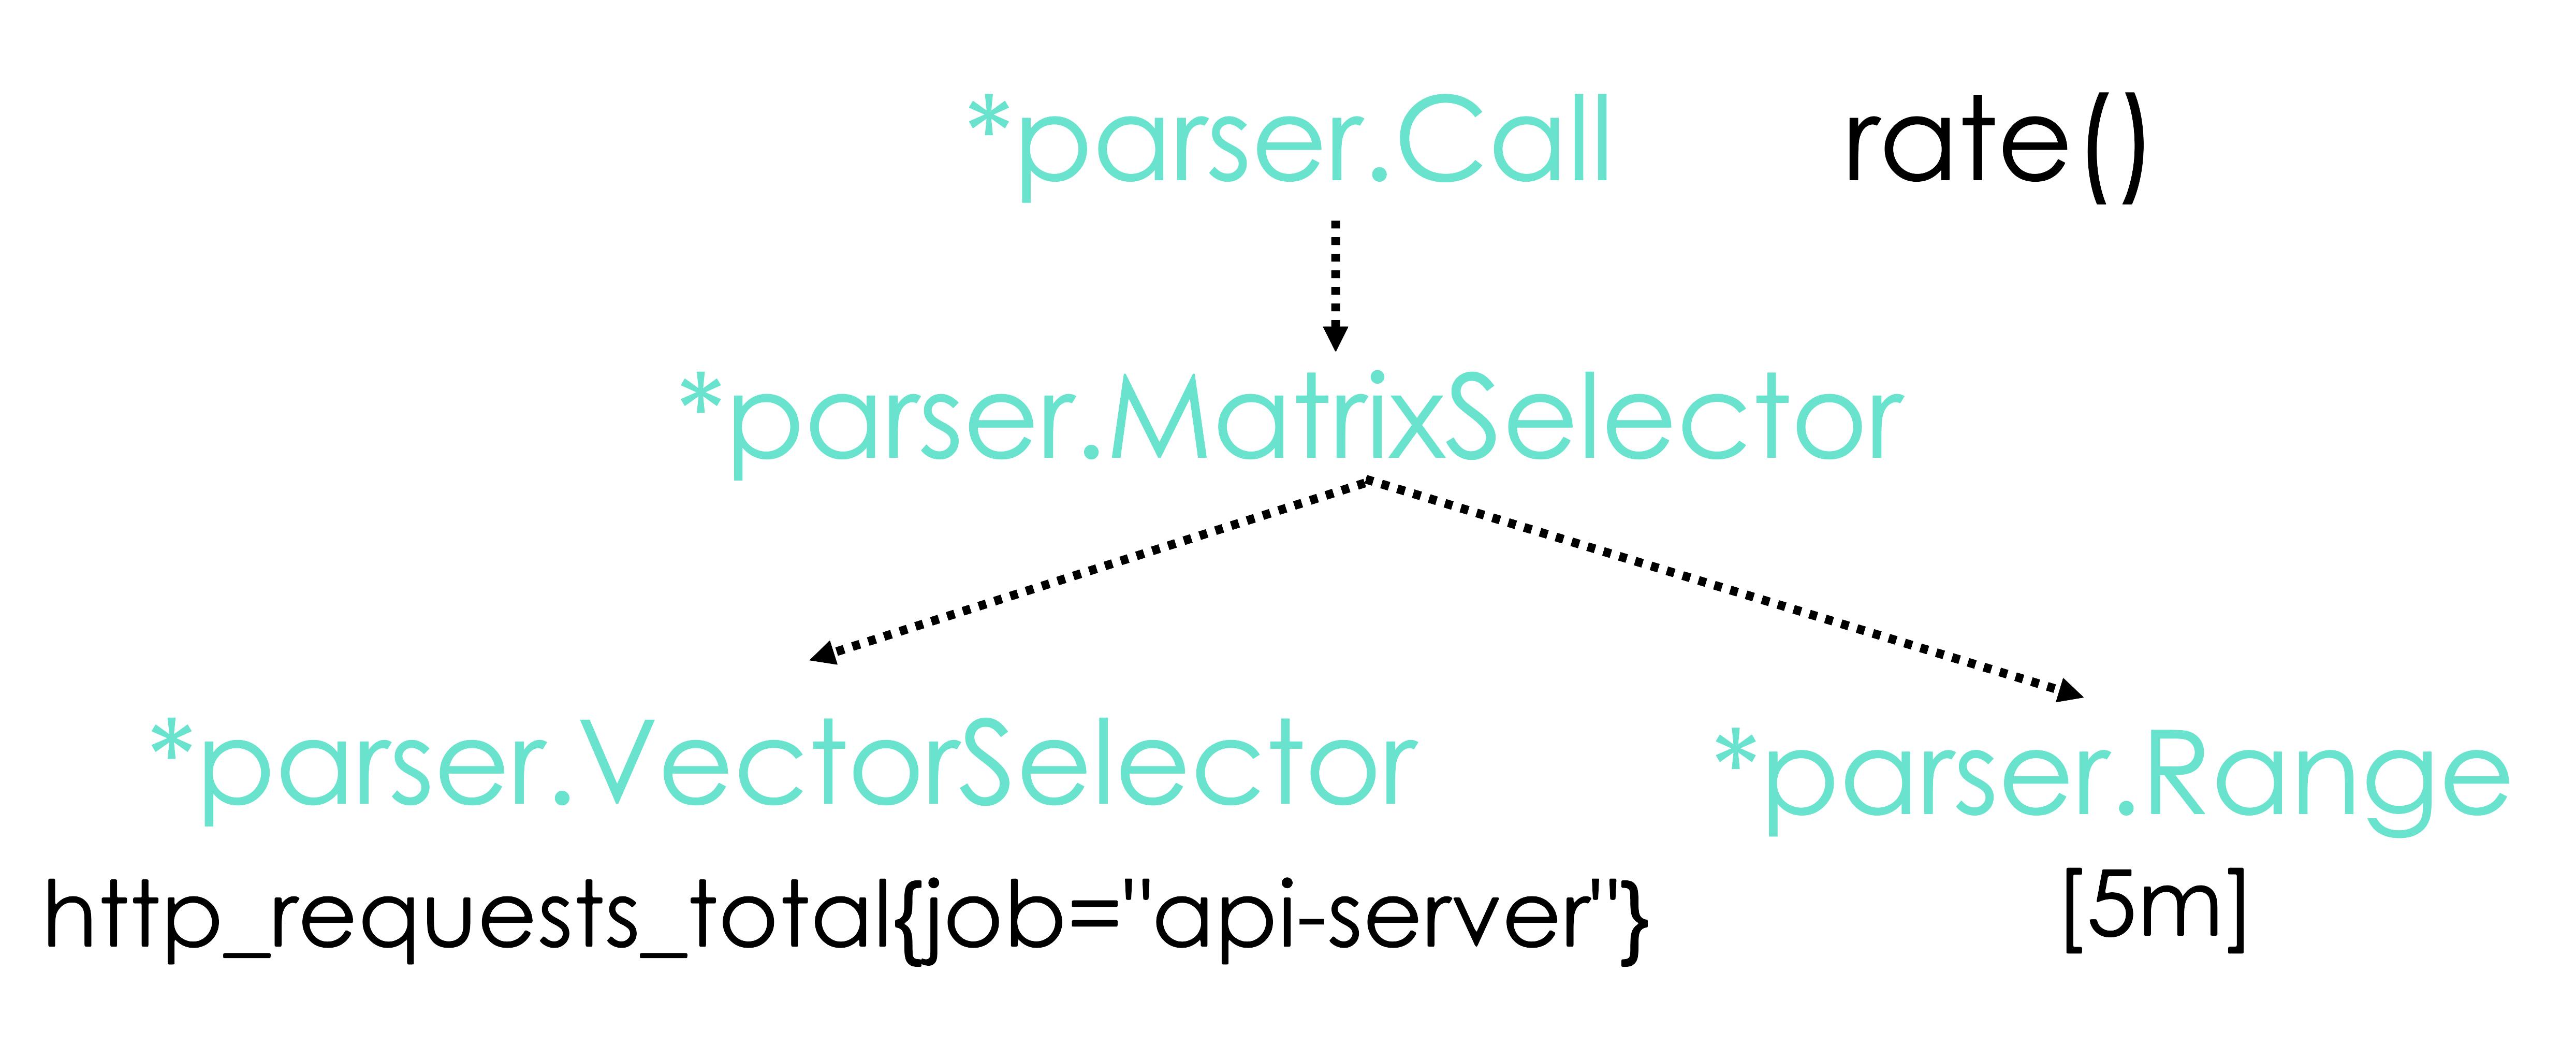
The AST shows the structure of the query in a tree-like format, where each node represents an operation or function call, and its children represent the arguments or operands. In this case, the top-level node is a function call to the rate function, which has two arguments: a vector selector and a duration scalar. The vector selector is itself a function call to the http_requests_total metric, with a label matcher that selects only the metrics with a job label equal to "api-server".
Expressions in PromQL consist of multiple elements, but for our purposes, we are specifically interested in the parser.VectorSelector nodes within the AST. These nodes are responsible for selecting metrics, and if we can modify them to enforce the rules outlined in the previous section, we will achieve our objective. To accomplish this, we must traverse the AST and modify all Vector Selectors accordingly. While it may seem daunting to implement a tree algorithm, it is not that complicated using a recursive function, which we outlined below.
Important Note: All code examples in this article have been simplified for clarity. For instance the code snippet below considers only case types relevant to the example discussed above. To parse any and all Prometheus queries, the code must consider all possible AST node types, which can be found here.
// LabelModifier is a function that modifies given Vector Selector to include
// all required labels to limit the set of results to what we want.
type LabelModifier func(*parser.VectorSelector) (*parser.VectorSelector, error)

// modifyLabels function modifies all Vector Selector nodes within the AST of
// the passed Prometheus Expression - the AST returned by the ParseExpr function.
func modifyLabels(expr parser.Expr, labelMod LabelModifier) (parser.Expr, error) {
	var err error

	switch exp := expr.(type) {
	case *parser.VectorSelector:
		expr, err = labelMod(exp)
	case *parser.MatrixSelector:
		exp.VectorSelector, err = modifyLabels(exp.VectorSelector, labelMod)
	case *parser.Call:
		for i := range exp.Args {
			exp.Args[i], err = modifyLabels(exp.Args[i], labelMod)
			if err != nil {
				return nil, err
			}
		}
	}

	return expr, err
}
The recursive function above is responsible for traversing the abstract syntax tree of the Prometheus query and modifying all *parser.VectorSelector nodes using the labelMod function. Although this function is relatively simple, we believe it could be useful to see how to implement it.
Now that we understand how to locate and modify each vector selector, let's explore how we might implement the labelMod function. As the rules become more complex, the implementation will likewise become more complicated. The labelMod function modifies one label at a time, with each label modification split into one of its sub-functions. To keep things simple, let's focus on enforcing the metric_purpose="external" rule to separate external metrics from internal ones.
// applyMetricPurposeLabel function enforces `metric_purpose="external"` label to be
// present on the provided vector selector.
func applyMetricPurposeLabel(vector *parser.VectorSelector) *parser.VectorSelector {
	// Filter out all occurrences of that label on the matcher.
	filteredLabels := make([]*labels.Matcher, 0)
	for i := range vector.LabelMatchers {
		if vector.LabelMatchers[i].Name != PublicMetricLabelName {
			filteredLabels = append(filteredLabels, vector.LabelMatchers[i])
		}
	}
	// Apply `metric_purpose="external"` label.
	filteredLabels = append(filteredLabels, &labels.Matcher{
		Type:  labels.MatchEqual,
		Name:  "metric_purpose",
		Value: "external",
	})
	// Assign the new updated label set to the Vector Selector.
	vector.LabelMatchers = filteredLabels
	return vector
}
And that's how we modify Prometheus query selectors! By traversing the query's corresponding abstract syntax tree using a recursive function, we can locate and modify the *parser.VectorSelector nodes. Additionally, we explored how to implement the labelMod function to enforce custom rules on the query labels.
Technical Challenges
During the implementation of the Metrics API service, we encountered a few technical challenges. It turns out that seemingly the most boring task presented the most interesting ones.
Ready, Set, Stream!
Implementing the /federate endpoint was necessary because Grafana Cloud (our metrics storage provider) doesn't provide it. Fortunately, all the data served by this endpoint could be fetched from /api/v1/query one, which is used for fetching instant vectors. The only difference, and the work we have to do, is response formatting. Sounds easy, right?
The problem is that some queries can have large amounts of metrics returned, especially if a customer was monitoring multiple organisations on our platform. This resulted in a huge memory footprint for our Metrics API, which was consuming around 500 megabytes of memory, making it hard to justify given it's such a small service. To solve this issue, we decided to stream both:
- the incoming JSON response from Prometheus,
- the formatted /federate response to the customer.
Streaming allowed us to parse the incoming JSON response as it was being transferred from the backend storage, format it, and send it to the customer in the /federate format without keeping the whole response in memory. Instead, we only kept the amount we parsed, which was just one metric at a time.
This resulted in the memory footprint reduction to just 15 megabytes, which is a 33 times decrease!
The Implementation
In this section we'll focus on memory optimisations that made such a drastic difference. In reality, the implementation has to consider many things. For instance - always populating the response with at least one metric. Otherwise, the federating Prometheus on customers' side would think that we are down if no metrics are returned, but in fact it could be that they've just inserted a query that returns an empty set of metrics. With that out of the way, let's see the code!
The biggest difference boils down to instead of using
err := json.NewDecoder(resp.Body).Decode(&metricsResponseStruct)to read the response all at once. We read it bit-by-bit, and decoding one token at a time, using:
func findKey(dec *json.Decoder, key string) error {
	for dec.More() {
		token, err := dec.Token()
		if err != nil {
			return err
		}
		if t, ok := token.(string); ok && t == key {
			return nil
		}
	}

	return error.New("Token not found.")
}
When we finally find the result key in the JSON response we can parse one metric sample at a time, using:
type PromMetricSample struct {
	Metric map[string]string `json:"metric"`
	Value  []interface{}     `json:"value"`
}

// Reset recycles PromMetricSample so it can be reused for decoding.
func (p *PromMetricSample) Reset() {
	for k := range p.Metric {
		delete(p.Metric, k)
	}
	p.Value = p.Value[:0]
}

var sample PrometheusQueryResponseMetricSamples
buf := bytes.NewBuffer([]byte{})

// At this point we know that we will read an array of samples
// and then finish as the decoder.More() will return false
// when we are out of items.
for dec.More() {
	// Decode each object as a prometheus sample.
	sample.Reset()
	if err := dec.Decode(&sample); err != nil {
		return err
	}
	// Buffers are the fastest way to concatenate strings and allow us to reuse
	// the buffer for every metric. This means we won't need to re-allocate space
	// every time.
	buf.Reset()
	buf = writeMetricInFederateFormat(buf, sample)
	if _, err := buf.WriteTo(writer); err != nil {
		return err
	}
}
In the above code you can see a summary of our memory optimisations. First we use one sample instance to decode all of the metrics. This means we don't need to allocate one struct for each new metric. We need to do some cleaning after parsing each metrics, but Go is very fast so we don't mind that.

After decoding a single metric sample we need to convert it to the /federate format. To do this effectively we use a helper buffer that allows us to quickly create the output array of bytes we need. We need this because in Go, strings are immutable, which means that once created, their value cannot be modified. Concatenating two strings, therefore, requires creating a new string that contains the contents of both strings. This process can be expensive both in terms of both memory allocation as well as copying. Using a buffer in Go can help mitigate this cost by allowing you to build up a string incrementally without creating a new string for each concatenation operation. A buffer is a mutable sequence of bytes that can be used to efficiently build up a larger string by appending smaller strings to it. When the byte representation of the final string has been constructed, you can use the String() method of the buffer to obtain the value.
We omit the implementation of writeMetricInFederateFormat as it just concatenates strings using the aforementioned buffer - no magic there.
Ta da! 🎉
Thank you for taking the time to read this article! We hope you found the information useful. Be sure to stay tuned for our upcoming articles where we'll cover metric ingestion solution and organisational challenges we faced when creating this product. Don't forget to follow us on social media to stay up-to-date with our latest content. Goodbye for now!
Written by


Piotr is an experienced technical leader, previously leading the FRAML (Fraud and anti-money laundering) team and now leading the engineering team responsible for implementing Data Mesh at Form3. With a focus on driving the data transformation of the organisation, Piotr is committed to creating a performant, self-serve data platform and bringing cutting-edge data management solutions to internal and external stakeholders.
Further resources
Blogs · 10 min
Dangling Danger: Route53's Flawed Dangling NS Record Protection
A subdomain takeover is a class of attack in which an adversary is able to serve unauthorized content from victim's domain name. It can be used for phishing, supply chain compromise, and other forms of attacks which rely on deception. You might've heard about CNAME based or NS based subdomain takeovers.
October 27, 2023
Blogs · 4 min
Applying the Five Ws to Incident Management
In this blogpost, David introduces us to the five W's of information gathering - Who? What? When? Where? Why? Answering the five Ws helps Incident Managers get a deeper understanding of the cause and impact of incidents, not just their remedy, leading to more robust solutions. Fixing the cause of an outage is only just the beginning and the five Ws pave the way for team collaboration during investigations.
July 26, 2023
Blogs · 4 min
.tech Podcast - All about conference speaking
Patrycja, Artur and Marcin are engineers at Form3 and some of our most accomplished speakers. They join us to discuss their motivations for taking up the challenge of becoming conference speakers, tell us how to find events to speak at and share their best advice for preparing engaging talks. They offer advice for new and experienced speakers alike.
July 19, 2023